HOME / Hardware / FBI-Gauge Post software
The FBI-Gauge comes with software that processes vast amount of measurement data obtained from the measuring equipment.
Normally, measurement data is output in three axes: values for longitudinal directions of the optic fiber, those for time, and those for strain and temperature. Accordingly, its processing is highly complicated with ordinary spreadsheet software.
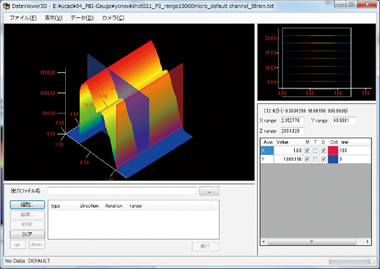
The FBI-Gauge comes with powerful post software which is capable of processing three-axis data. This software permits quick processing for noise elimination, creation of 2D and 3D graphs, and handling of 3D visualization tool. This permits conversion of the data into intuitive output results and easy-to-understand graphs.
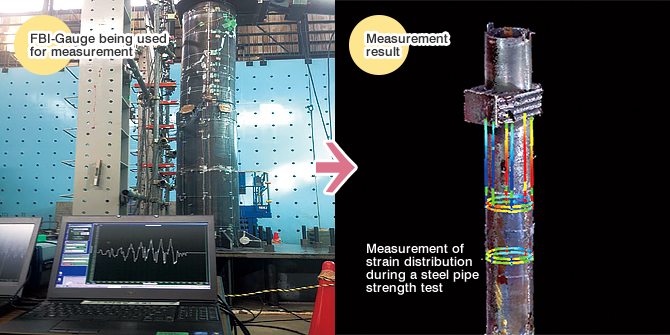
Set up the optic fiber sensor three-dimensionally as you like, measure temperature and/or strain, and use this tool to visualize the obtained data in 3D graphics. This will allow you to create a video showing the results, which makes you feel as if you were seeing the actual object on site. The t ool uses point group obtained from 3D CAD of the object or 3D laser scanner to convert the strain and/or temperature into 3D contour graphics. This allows you to check intuitively where the peak is and what the gradient is like.

FBI-Gauge can be used in combination with 3D laser measurement to produce photograph-like report of measurement results.
The FBI-Gauge comes with functions for processing noise, which is generated frequently in optical measurement, and detaching only necessary parts. This enables quick p rocessing of 3-axis data, which is difficult with spreadsheet software.

- 3D analysis
(typically displayed as 3D color contours)
- 3D dimensional measurement
- 2D graphing
- 3D graphing
- Filtering functions
- Other analysis and evaluation tools
System overview /
Features /
Post software /
Distributed strain measurement /
Use of FBI-Gauge in the automotive industry
Use of FBI-Gauge in industrial facilities and in the construction industry /
Product seminars


